Written by StreamYard
How to Analyze and Measure YouTube Live Streams
You've got good content, the knack to create engaging live videos, and the right equipment. But is that enough?
Not entirely.
You need to know how to track the success of your live video, analyze whether or not your content is well-received by viewers, and measure the performance of your live streams.
In this article, you'll learn tips to help you analyze and measure YouTube Live streams.
Remember, measuring YouTube Live stream metrics is a whole new ballgame for most live streaming beginners. It's not just reviewing YouTube Analytics and tracking your videos' performance.
Apart from analyzing how your live content works post-live, you also need to track real-time metrics. That's because your live content ties into your overall video strategy. And you need to focus on the right key performance indicators (KPIs) to figure out what works best for your YouTube broadcasts.
So, read on as we break down the key metrics to help you analyze and measure YouTube live streams.
Metrics to measure YouTube Live streams | Real-Time Analytics
Source: YouTube Creators
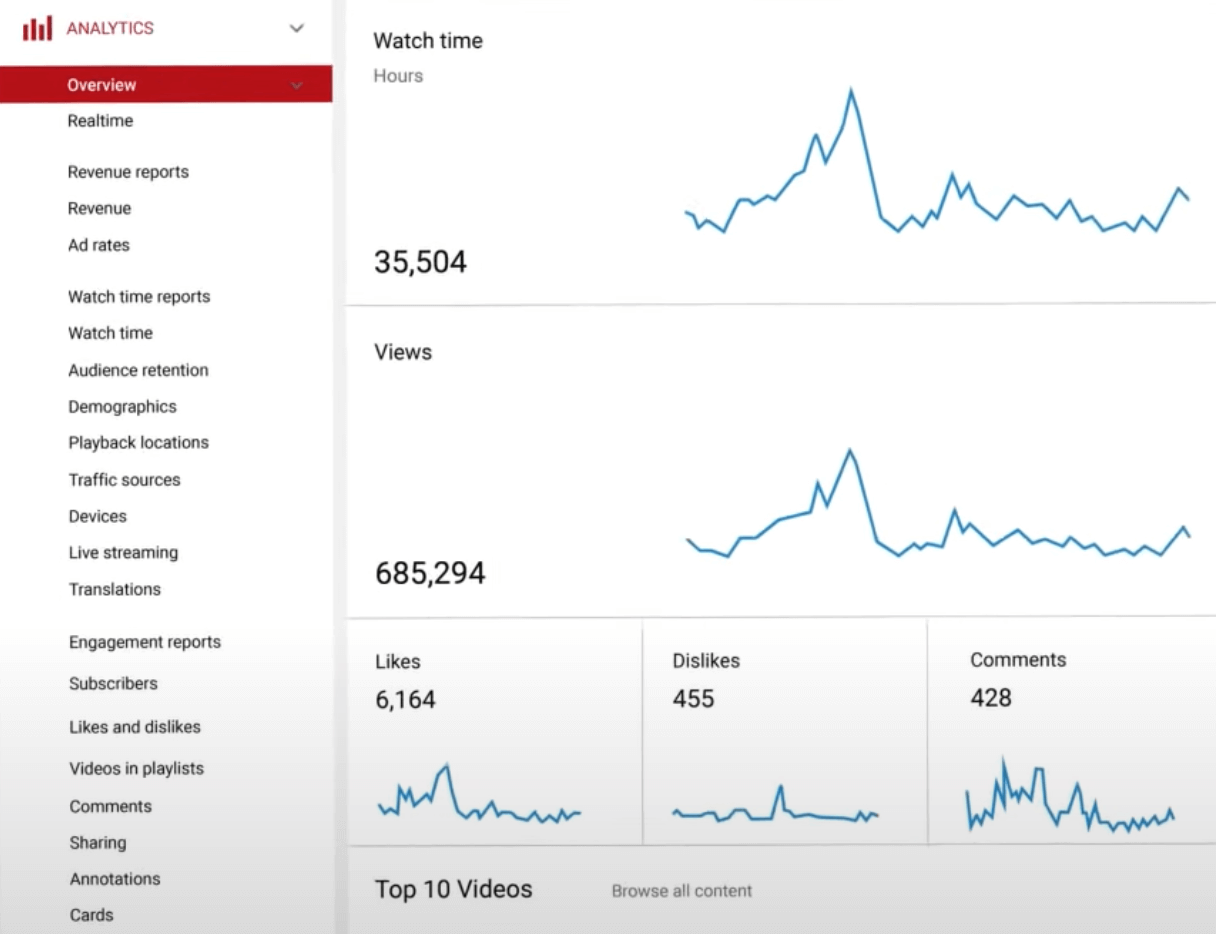
Here are the key metrics that you can track from your YouTube dashboard in real-time:
Concurrent Viewers
Concurrent Viewers are the viewers watching the stream simultaneously. By figuring out the highest number of concurrent viewers in your broadcast (peak concurrents), you can determine which segment of your live stream that your audience likes the most. You can also compare the peak concurrents of different live streams to discover which topics interest your viewers, where they drop-off and more.
Likes
Source: YouTube Creators
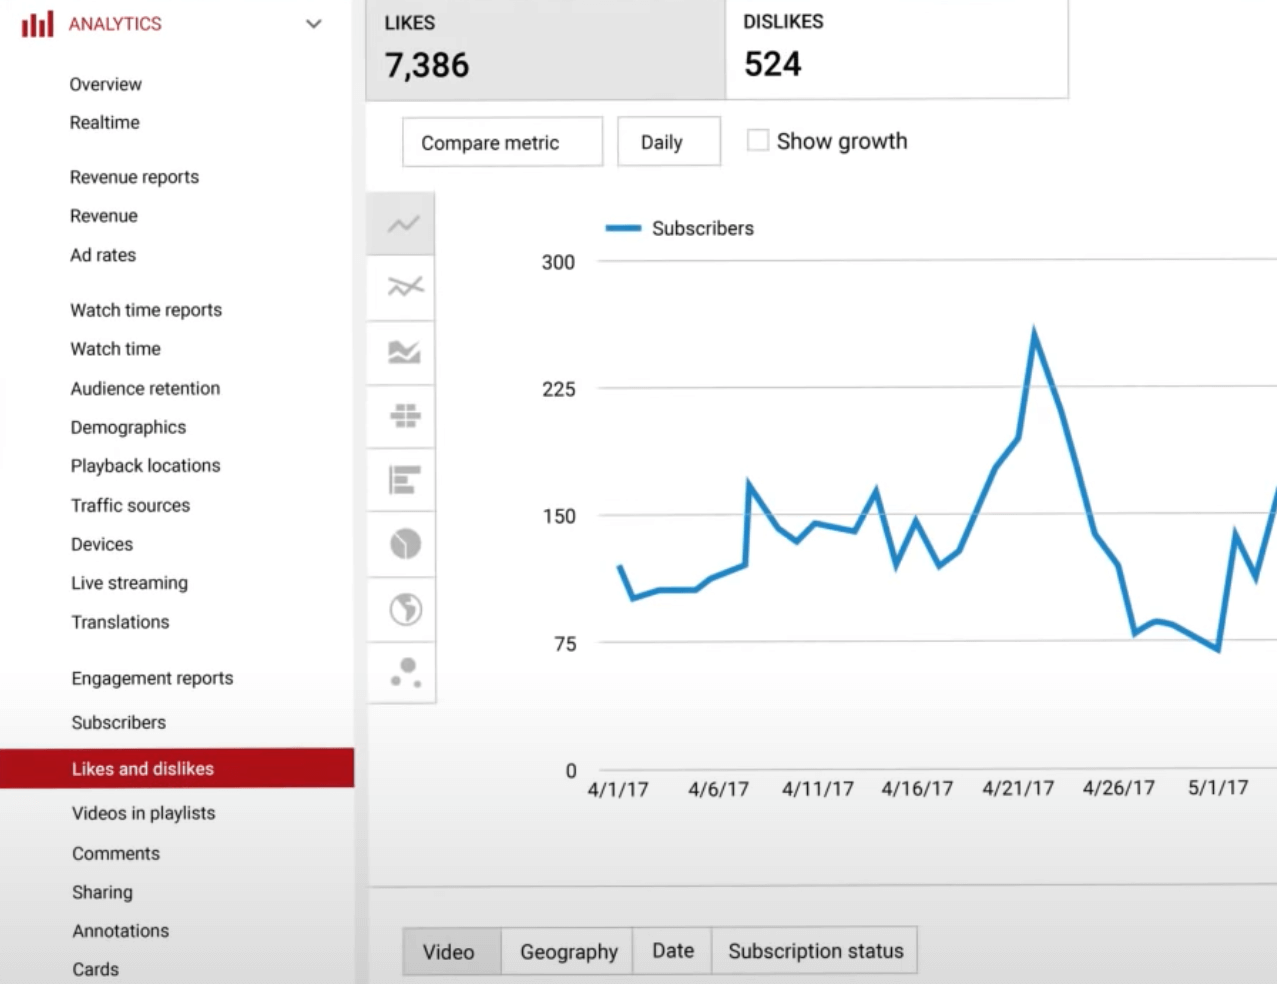
You can easily track the engagement of your live video by looking at the number of likes received during the stream. Once the live stream has ended, these likes then transfer to the stream's video on demand (VOD) archive.
Chat Rate
Another excellent parameter that defines your live broadcast's audience engagement is the Chat Rate. This is the rate or number of messages received in your stream per minute. Remember, if you have an active chat during your live stream, you'll see a higher chat rate. That number can drop off after your live stream has ended, so don't be alarmed.
Playbacks
Ever watched a live video and dropped out of it just to rejoin again? Playbacks is the number of times a live stream has been loaded on a device or a browser. While it does include page refreshes, changing video resolution isn't considered while counting the playbacks for a given stream.
Average Watch Time
Do most of your viewers stay around for the entire video? On average, for how long does a viewer watch your live stream? Average watch time reveals just that. As the name indicates, it is the total time viewers have watched a live stream divided by the playbacks. This is important when you are live streaming. If your streams are very long (1 hour or more), but the average watch time is short (30 seconds to 1 minute), you may want to experiment. One thing you can try is to run a shorter live stream, to see if you can get viewers to watch for longer amounts of time.
Streaming Success – What's a successful live video as per YouTube Analytics?
What you measure ultimately determines the success of your video. Two ways of measuring your success are 'average watch time' and 'viewership'. Even though the rules or parameters differ for different platforms, YouTube counts a view only when a person has seen the video for 30 seconds or more! So, you've got to make the first 40 seconds of your video extremely interesting if you're simply looking for more views.
Here are a few tips that can help make your live stream a success:
- Try going live for more than 20 minutes since this increases engagement. Viewers who have just signed in might catch the last 10 minutes and watch the video again when it remains on YouTube as recorded content.
- People who have subscribed to your channel receive notifications when you've scheduled a live session/video. So, make scheduling your videos a common practice. You can schedule your YouTube Live videos without any hassles using StreamYard.
- Paid promotions are always an investment. If you aim to achieve specific marketing goals, it's best to promote your video on multiple channels. You can also use email marketing to remind people to tune in on a particular date and time.
- Less is sometimes more. If you live stream for more than a few hours at a time, your YouTube channel subscribers might be deterred because of the length of your live streams. Experiment with various lengths, to see where the sweetspot might be.
Once your live stream becomes a recorded video, you won't get many chances to interact with your audience. If you share value-added content, you can still achieve some long-term goals with your video.
Metrics to measure YouTube Live streams | Post-live Analytics
To get a handle on your YouTube Live stream's success, you can also check the stream metrics once the live is over.
Playbacks
As mentioned previously, the number of playbacks refers to the number of times a browser or device has played the video. So, when your live stream is saved as VOD, this number determines the total number of times a browser or device has played the saved live.
New Subscribers
With most of the YouTube content focused on gaining subscribers, this one is a pretty important metric for any live streamer. The total number of New Subscribers tells you how many users have subscribed to your channel while watching your stream. Try to create engaging and value-added content to improve this metric and, ultimately, your brand awareness.
Total Watch Time
As a viewer, have you ever clicked on a video with a catchy title, only to learn later that you're not interested in watching it at all? What would you do if it was, say, a 30-minute-long video and you don't have the patience to see more? You might stop it midway and move on. This is why watch-time is a crucial metric to measure YouTube live streams.
So, don't forget to measure your YouTube Live streams' viewership by tracking this metric. The total watch time shows the total amount of time your live video was played for. Keep in mind, videos with more watch time are usually more engaging.
Peak Concurrents
The peak concurrents is the highest number of views attained in a stream. Use this metric to find out how many viewers tuned in together during the video.
Average Watch Time
Post-live analytics also reveals the average watch time, which is the total watch time of the video divided by the total playbacks, including replays.
Note: Post-analytics metrics in YouTube Analytics are available on average, 48-72 hours after a live stream is over.
Metrics to Measure YouTube Live streams | From YouTube Analytics
Besides the metrics mentioned above, you can also find more metrics under YouTube Analytics that you can sort by Live, On demand, or Live & on demand.

Source: YouTube
Some of the extremely vital metrics that you can find here include:
Audience Retention
Source: YouTube Creators
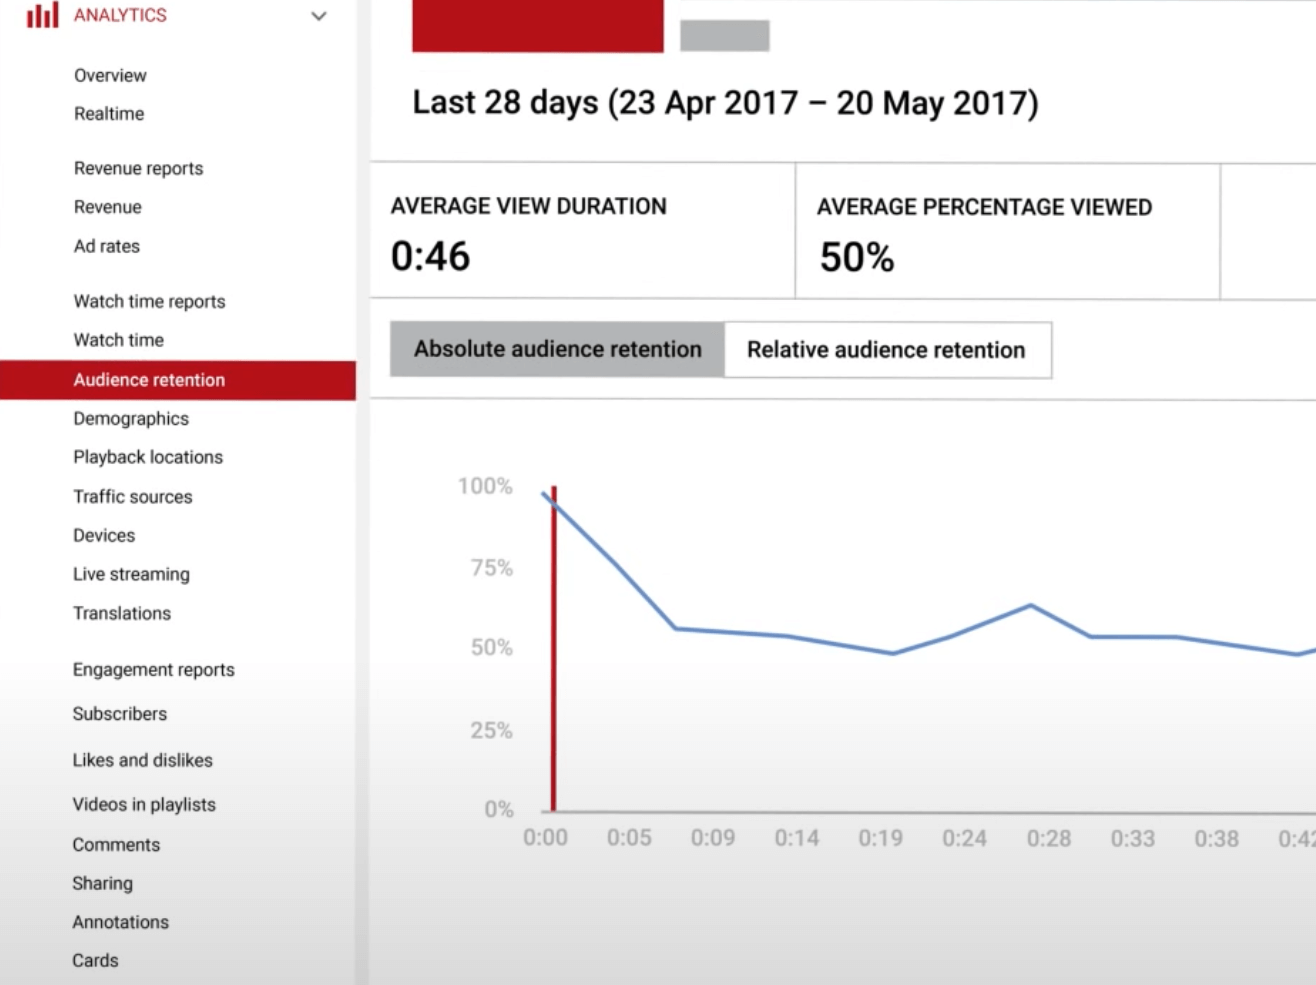
Audience retention is a vital metric that measures the number of viewers who watched the entire live stream after hitting the play button.
In other words, it shows the percentage of viewers who 'stick around'. It enables you to assess how many people viewed or stopped watching the video by monitoring these actions at every second of the entire video. If your video has a higher retention rate, it's most likely to 'pop up' amongst the most viewed videos.
Plus, by finding out the audience retention at different times of the day, you can determine when your audience is usually the most engaged and which topics interest them the most. This way you can adjust your YouTube Live strategy.
Demographics
Source: YouTube Creators
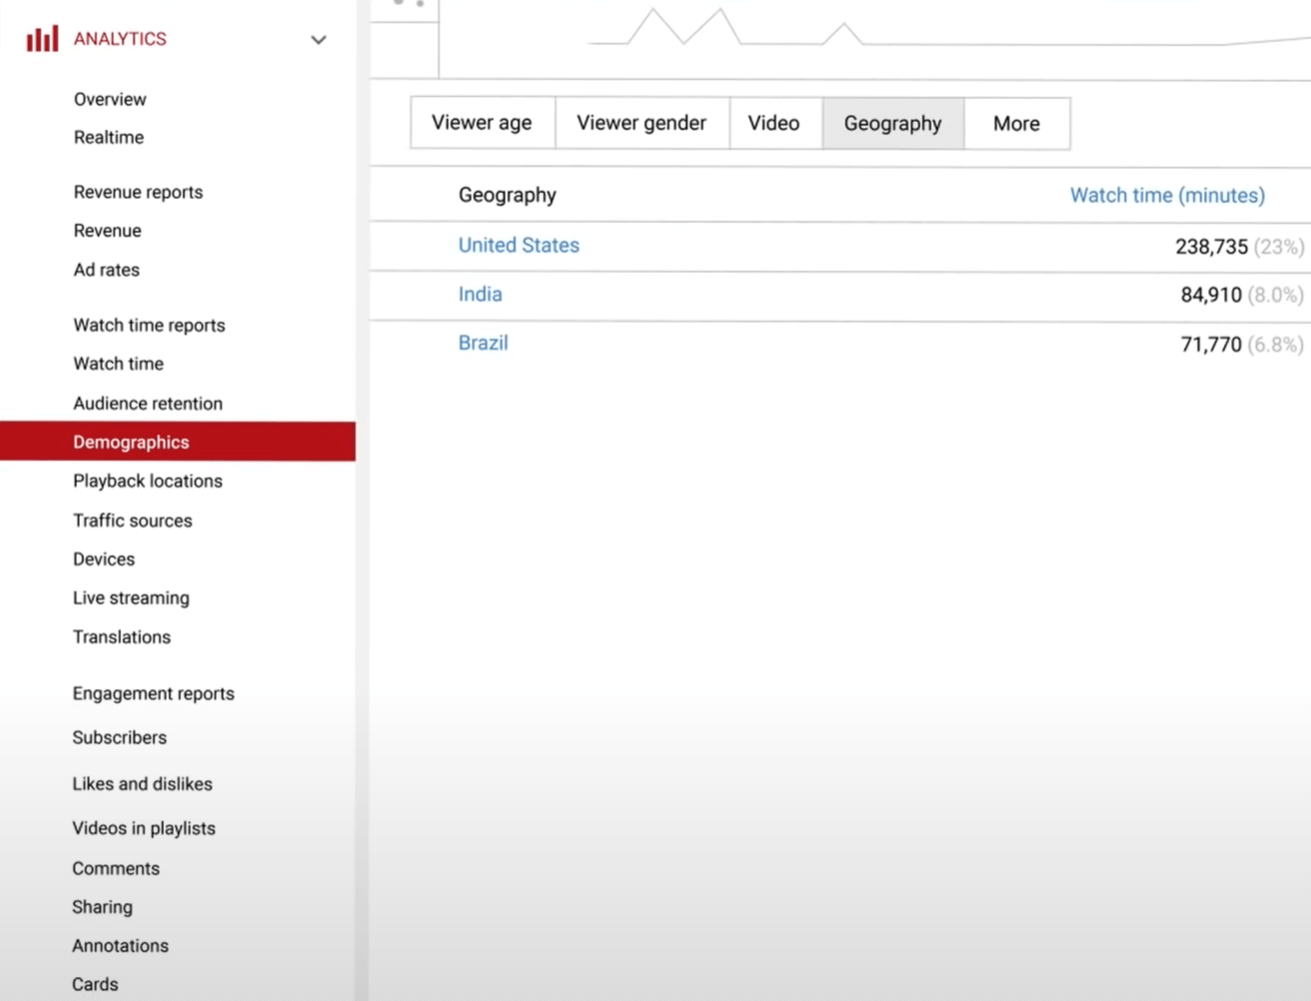
Knowing how many people watched your video isn't really enough if you want to measure YouTube Live streams. Remember, demographics play a key role in gauging whether or not the content appeals to your target market.
The Demographics report shares information about your viewers' age, gender, and location, etc. You can compare the demographics of different streams to know more about the various levels of engagement based on different personas. If your videos are not reaching who you think your target audience is, it may mean you need to adjust your content, presentation, or even the thumbnail, to bring in the right viwer.
Playback Locations
One of the good things about YouTube is that it makes embedding videos outside of YouTube easy. This means your videos can be shared in different ways on various platforms, including on your own website. The Playback Locations metric indicates all those sites your saved live videos are being viewed on.
It's a fantastic way to learn which type of content is being shared on other websites. You can also learn where your viewers prefer to watch. This way you can plan where you need to spend the most time, engaging with them.
Traffic Sources and Devices
As a content creator, you need to know exactly how viewers of varying age groups and locations came across your video. Did they search for your video on YouTube or simply clicked the Suggested Video thumbnail? This is information that the Traffic Sources report reveals.
These traffic sources could be YouTube search, browse features, playlists, suggested videos, YouTube ads, notifications, external sources, etc.
Similarly, the Traffic Devices report provides information about the different devices that viewers use to watch your live streams. This can be especially useful to help you discover if most of your viewers use a smartphone, tablet, or a laptop to watch your video.
By measuring this metric, you can tweak your video production, promotion, and outreach strategy for better results. For example, if a significant chunk of your views comes from TVs, you may want to create more of those 30-minute guest interviews instead of shorter content that mobile users usually love. Likewise, if your viewers are watching primarily from a mobile device, you'll want to ensure your thumbnail images work well on a smaller screen.
Can these metrics prove why your video was or wasn't successful?
That's the big question now.
These metrics can really help answer questions about your future moves for your YouTube live streams. They can't be a definitive measure though about when to upload your content, why your video was or was not successful, or even why a competitor generated more viewers than you.
Many factors such as budget, type of content, and different goals play a part in directing your video's performance. That said, these metrics can help you analyze and measure your YouTube Live stream's performance to a greater extent, so that you can course correct when you're streaming to YouTube Live.
So, get the hang of these metrics and tailor your future live content accordingly.
